Gross Profit Margin vs Net Profit: What Really Matters
-
 By
Arthur Kellan
By
Arthur Kellan
- Business
- # strategies
- 5 min read
- Business
- # strategies
- 5 min read
Do you have a brilliant product or service, but you don’t understand how to organize everything (from production and partnerships to repeat sales) to get real money instead of endless debt? Actually, the problem may lie in a misunderstanding of economic fundamentals. Unfortunately, in any business, you can’t do without numbers, so let’s understand why seemingly high margins can bring you to colossal losses in the end.
What Gross Profit Margin Measures
In a nutshell, gross profit margin is an indicator of how efficiently a company creates its product before marketing efforts, legalization, the manufacturer’s need to pay for rent for physical retail locations and warehouses, and so on. Essentially, it’s the difference between revenue and direct production costs. Here’s the gross margin formula, expressed in dollars:
Gross profit = Revenue – cost of goods sold
So, what can you understand from the gross profit margin calculation?
- Production capacity. If this metric is higher than your competitors’, it means you’re either buying raw materials cheaper, producing faster, or your brand allows you to set a high markup thanks to its good image;
- The viability of your business model. If this metric is 5-10%, you have no room for error in pricing. Thus, even the slightest price fluctuation due to changes in logistics will bring you a loss.
Let’s take iPhones with their gross margin 40%+ [1], which is abnormally high for a product in this category. This means that even if their sales decline, they still have enough money to cover their billion-dollar research expenses.
What Net Profit Actually Reflects
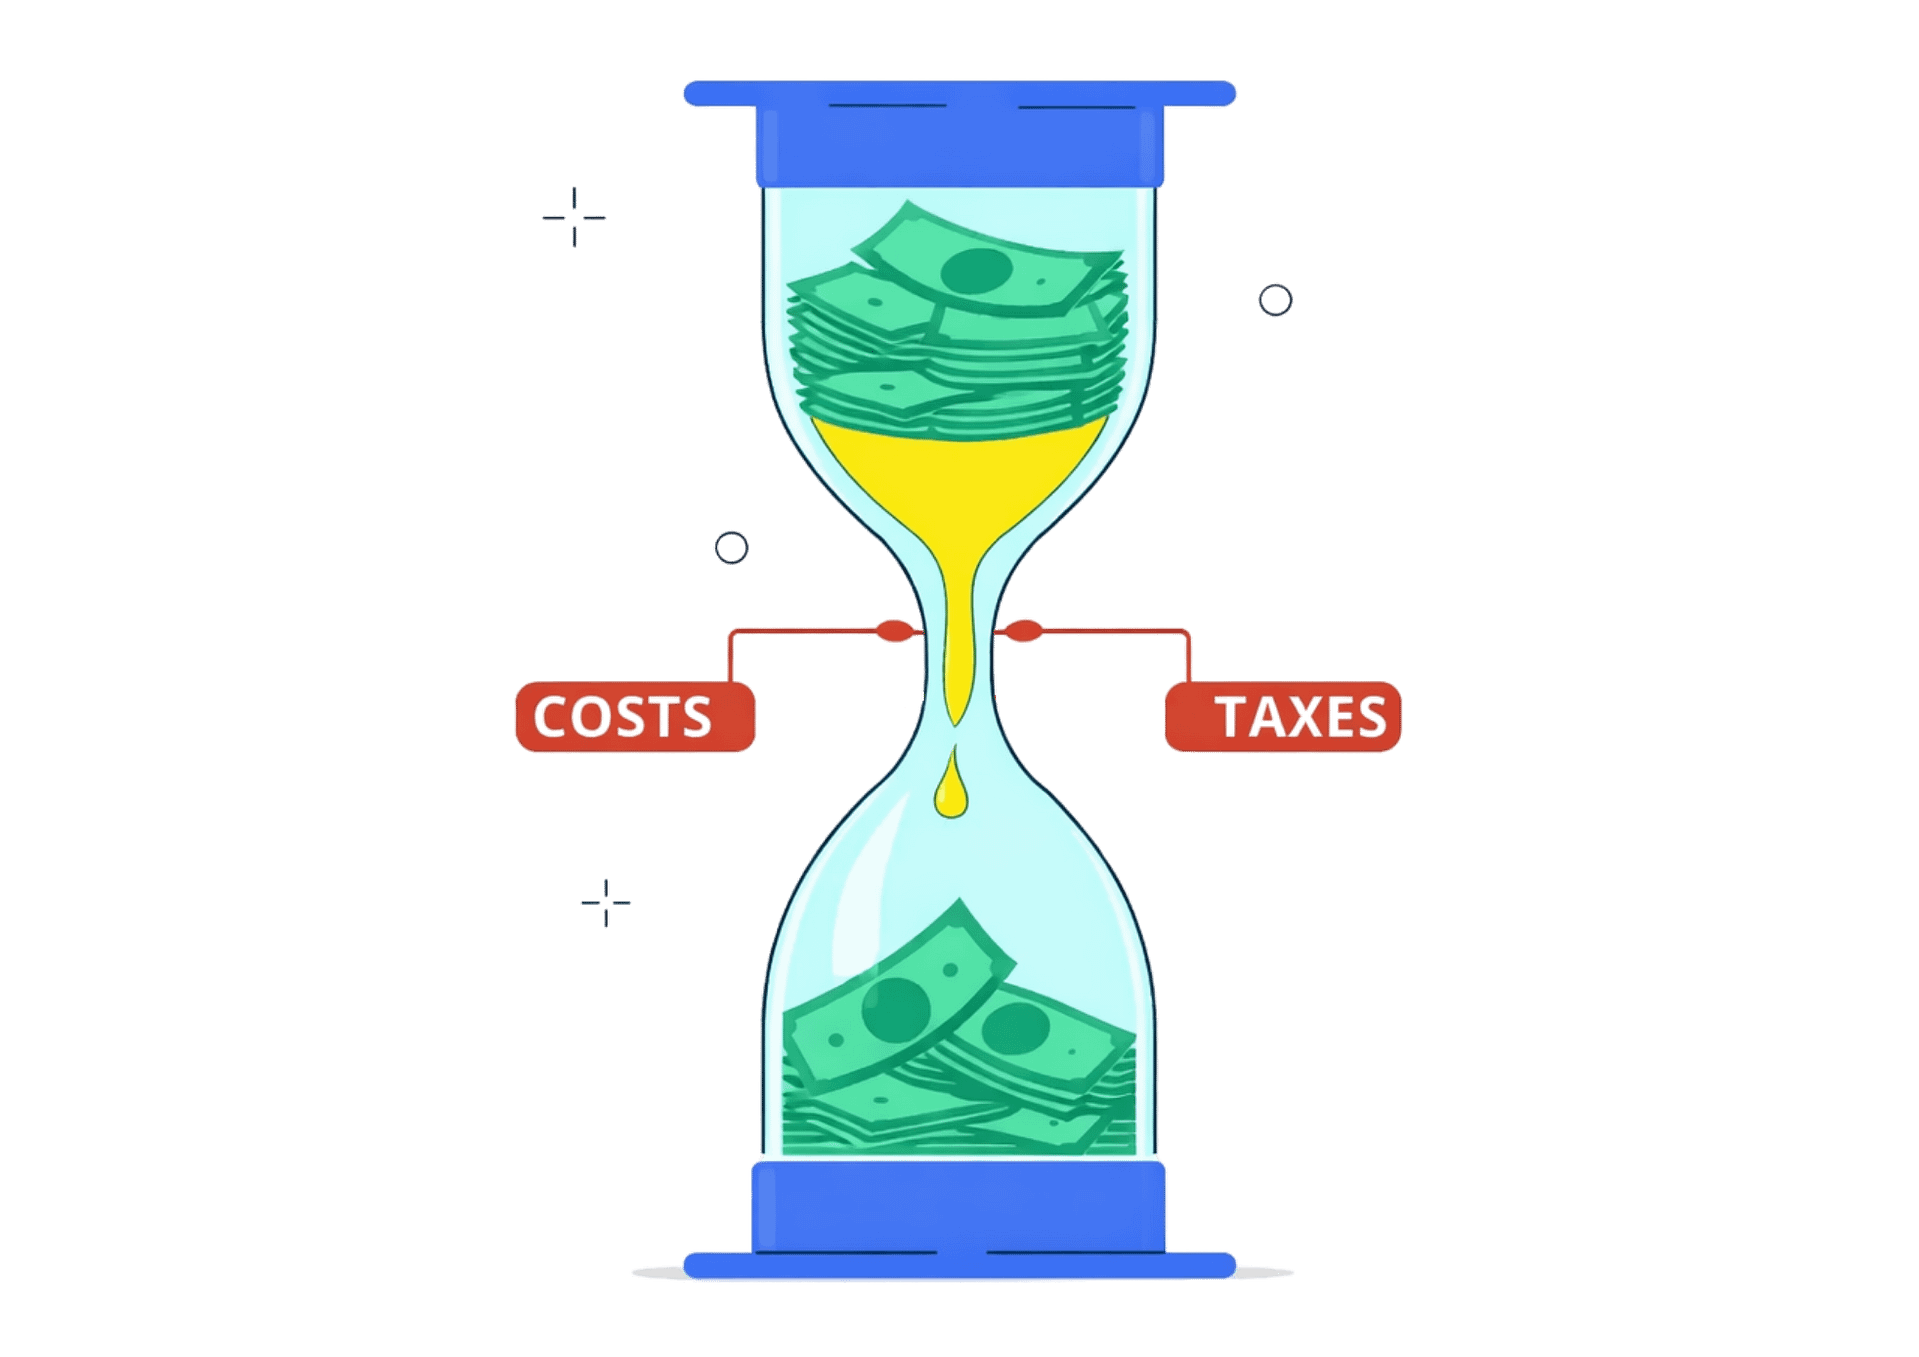
In simple words, this is what remains after paying for labor and resources. It takes into account operating expenses (rent of production facilities, employee salaries, ads, etc.), as well as interest on loans and, of course, taxes. Here’s its formula in dollars:
Net profit = Gross profit – operating expenses – interest – taxes
Here’s what it highlights:
- Management efficiency. You may have excellent products, but you can also unnecessarily spend a lot of money on an overstaffed company or offices.
- Credit burden. This metric reflects the extent of your business’s debt.
This is the only metric that shareholders care about in the long term, as it’s from net profit that you pay dividends and build reserves for “a rainy day”. For example, Walmart has a small gross margin (around 24-25%) [2], but thanks to optimized supply chains and huge turnover, its net profit remains stable.
Why High Gross Margin Doesn’t Guarantee Success
High gross margins can convince you that your business is functioning as it should. However, things aren’t so rosy – companies can still fail, and here’s why:
- Customer acquisition can be too expensive. In the SaaS industry, gross margins can reach 80-90%, but if you spend more to attract a single customer than they generate in a year, your profit will be negative.
- Businesses can face infrastructure paralysis. Companies with high-margin products sometimes overlook operational costs, as happened, for example, with Peloton and its smart exercise machines. During the COVID-19 pandemic, they had excellent sales, but huge marketing and logistics expenses quickly led to losses of hundreds of millions of dollars [3].
Industry Differences in Profit Metrics
You must understand that there is no one-size-fits-all formula for profitability. What may be considered a disaster in one industry may be a success in another.
For example, let’s take the technology and SaaS sectors. Here, we often see very high gross margins of up to 70-90%. This is because creating a copy of software costs pennies, while net profit can still be low or negative for years simply because the company invests heavily in R&D and aggressive marketing. If we consider retail, the situation is different: gross margins may be as low as 15-20%, but because products sell very quickly, the company thrives with a net margin of 1-3%. Finally, a few words about pharmaceuticals – capital investments here are often too high, so representatives of these sectors need gross margins of 70%+, simply to be able to cover billions in losses from clinical trials of drugs that don’t sell well.
Which Metric Investors Watch First
Investors always evaluate financial performance metrics through the lens of a company’s lifecycle and overall macroeconomic situation.
So, if we’re talking about the growth stage, the gross margin is a priority. This allows investors to understand whether the product is scalable – that is, if this metric is high, in the future, when the company stops spending huge amounts of money to capture the market, it will be able to become a “printing press”. This means the company has great long-term potential.
As for the value stage, the focus shifts to net profit and free cash flow. Investors want to see dividends and share buybacks, so if a mature business faces declining these metrics while its gross margin remains stable, it likely means it has gone under bureaucracy and poor management.
When it comes to a bear market, that is, when money in the economy becomes too expensive, investors have to put potential second and focus on net profit. And this is quite reasonable, since the current market no longer believes promises of profitability in 5-10 years.
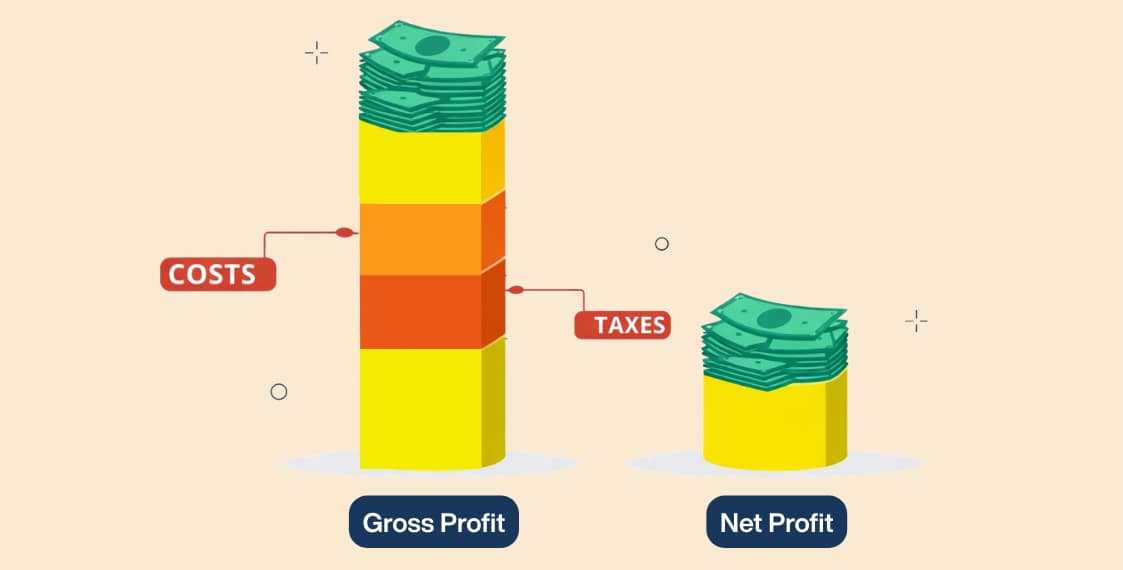
Conclusion: Margin Is Context
To summarize the gross profit vs net profit difference, the 1st one demonstrates a product’s potential, while the 2nd signals the true viability of the entire business structure. So, true financial management skill lies in preventing operational chaos from eroding the profits your high-quality product has brought to the market.
Sources:
[1] – Apple’s $4 Trillion Valuation Explained
[2] – Walmart’s gross profit margin worldwide 2025
[3] – The rise and fall of Peloton, from pandemic-era success story to its stock hitting a record low

Arthur Kellan
Discover with Vireon Press

The Gordie Howe Bridge: Redefining Cross-Border Opex

The Dry Powder Dilemma: Private Credit’s Deal Drought

How Companies Lose Revenue Through Poor Onboarding